
Chairman’s Office of a Leading Indian Corporate & Industrial Group — ZonAir3D conducted a rigorous, timestamped air quality evaluation at the Chairman’s Office of a prominent Indian corporate and industrial group. Four readings were captured over 110 minutes using a calibrated Trotec PC220 particle counter, measuring particulate matter, AQI, TVOC, and CO2 — before and after ZonAir3D activation. This case study is published anonymously at client request.
The space had both the HVAC system and the air purification system turned off overnight. Initial readings revealed elevated particulate matter, AQI in the Moderate range (69), and TVOC levels approaching the upper boundary of safe limits. ZonAir3D and the AC were activated simultaneously at Reading 2, with progressive readings taken at 30-40 minute intervals across two rooms.
All results were documented with timestamped device photographs and live video footage captured directly from the Trotec PC220 sensor. No editing or post-processing was applied to the recorded data.
Executive environments present a unique air quality challenge — sealed, recirculated air, high occupancy, and extended daily usage. The Chairman’s Office had no active air purification in place. Pre-treatment conditions at baseline (10:00 AM, AC off overnight):
All four readings photographed directly from the Trotec PC220 particle counter screen at each timestamped interval. Unedited field photographs.
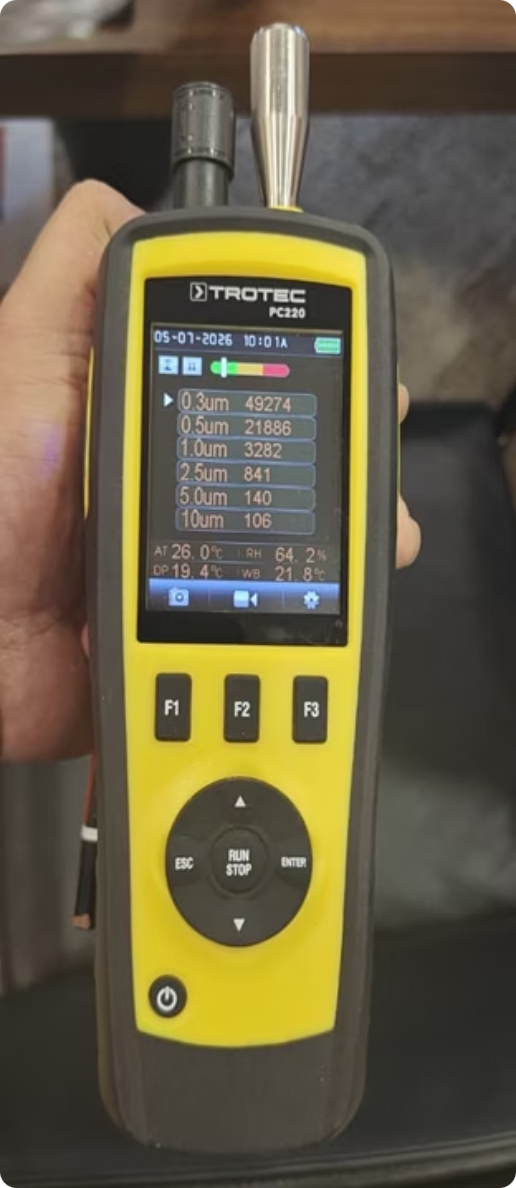
Reading 1 10:00 AM – Baseline AQI: 69
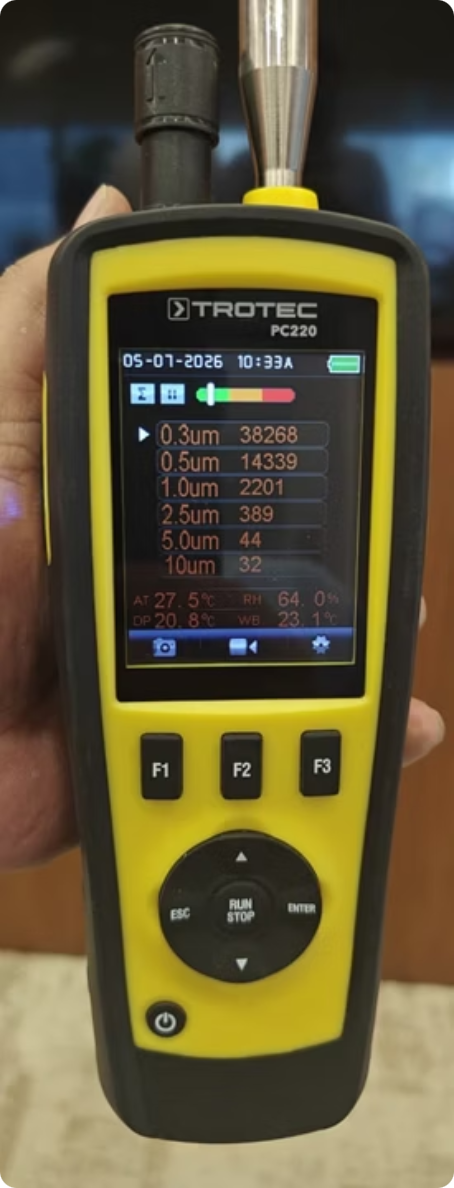
Reading 2 10:33 AM – ZonAir3D ON AQI: 47
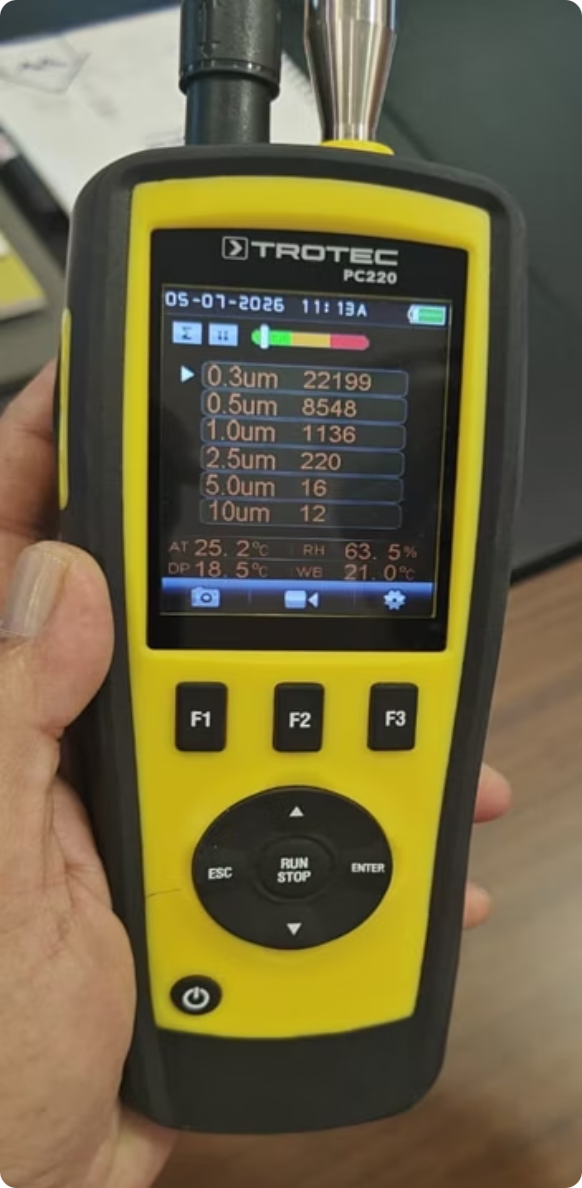
Reading 3 11:13 AM – ~70 min AQI: 34
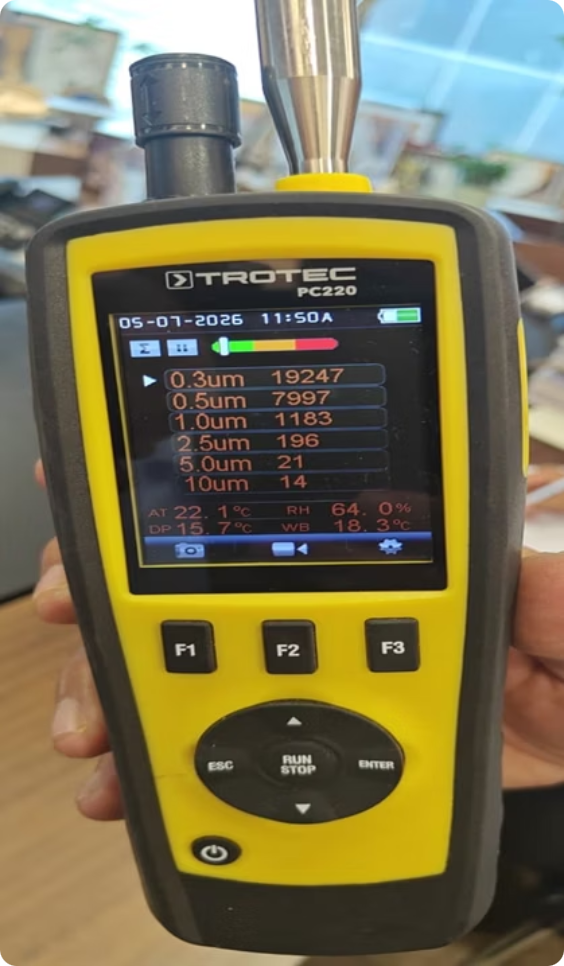
Reading 4 11:50 AM – Final AQI: 21
| Reading / Time | 0.3um | 0.5um | 1.0um | 2.5um | 5.0um | 10um | AQI | TVOC | CO2 |
|---|---|---|---|---|---|---|---|---|---|
| Reading 1 10:00 AM – Baseline | 49,274 | 21,886 | 3,282 | 841 | 140 | 106 | 69 | 0.38 | 768 |
| Reading 2 10:30 AM – ZonAir3D ON | 38,268 | 14,339 | 2,201 | 389 | 44 | 32 | 47 | 0.35 | 421 |
| Reading 3 11:12 AM – ~70 min | 22,199 | 8,548 | 1,136 | 220 | 16 | 12 | 34 | 0.17 | 409 |
| Reading 4 11:50 AM – Final | 19,247 | 7,997 | 1,183 | 196 | 21 | 14 | 21 | 0.14 | 417 |
AQI improved from 69 (Moderate) to 21 (Good) — a 70% reduction in under two hours. Crossed below the 50-point “Good Air” threshold within 30 minutes of activation.
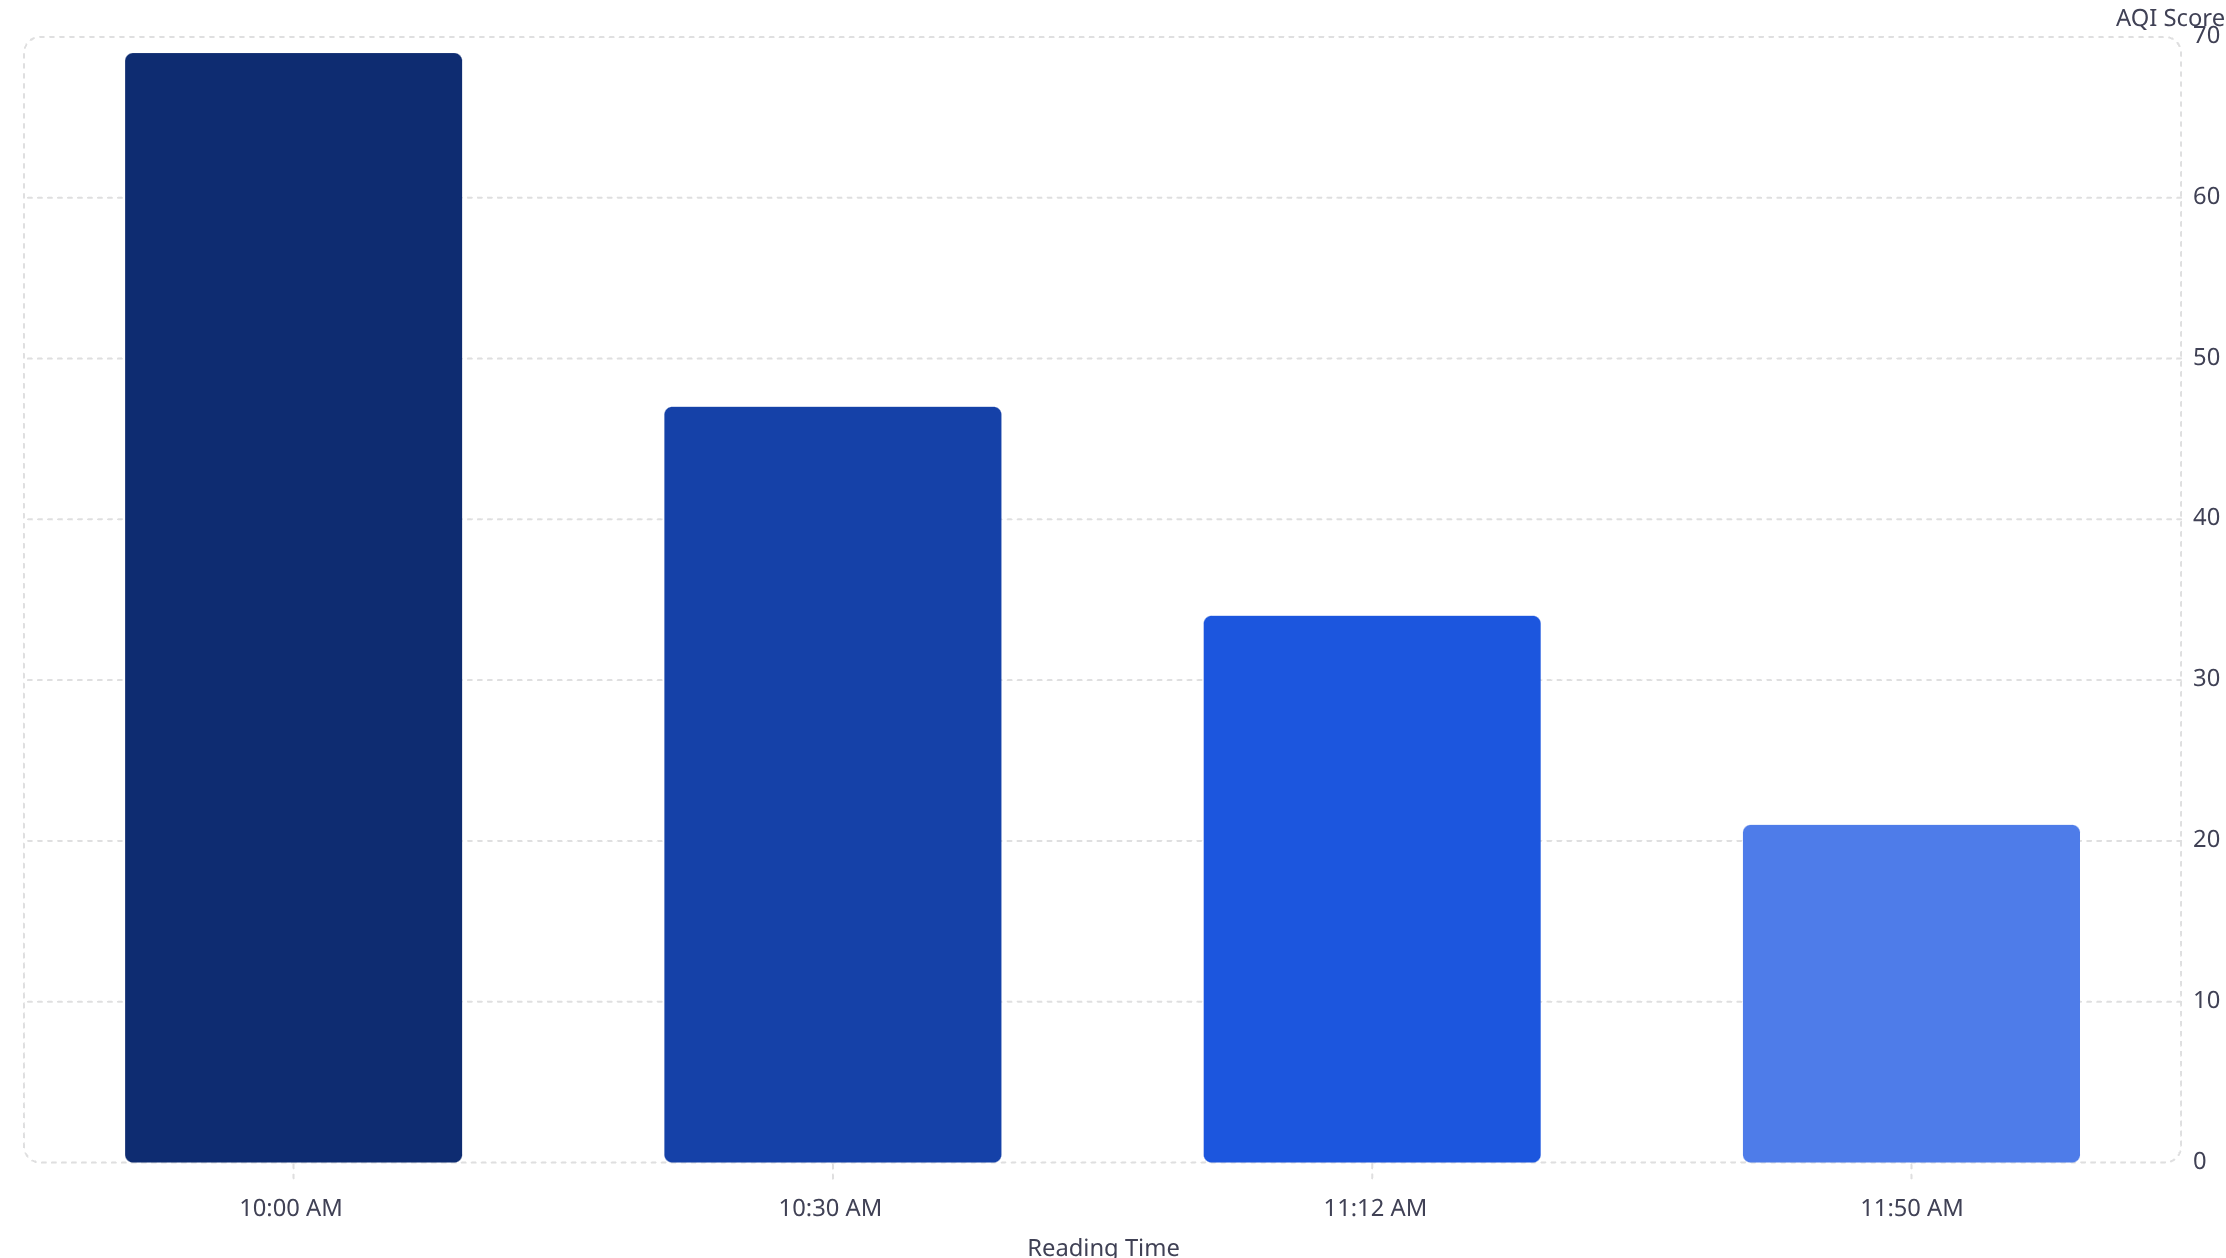
AQI Score across four readings · Good Air threshold = 50
Target: below 0.50 mg/m3 · All readings compliant. TVOC dropped 63% from 0.38 to 0.14 mg/m3 — well within the safe threshold throughout the entire monitoring period.
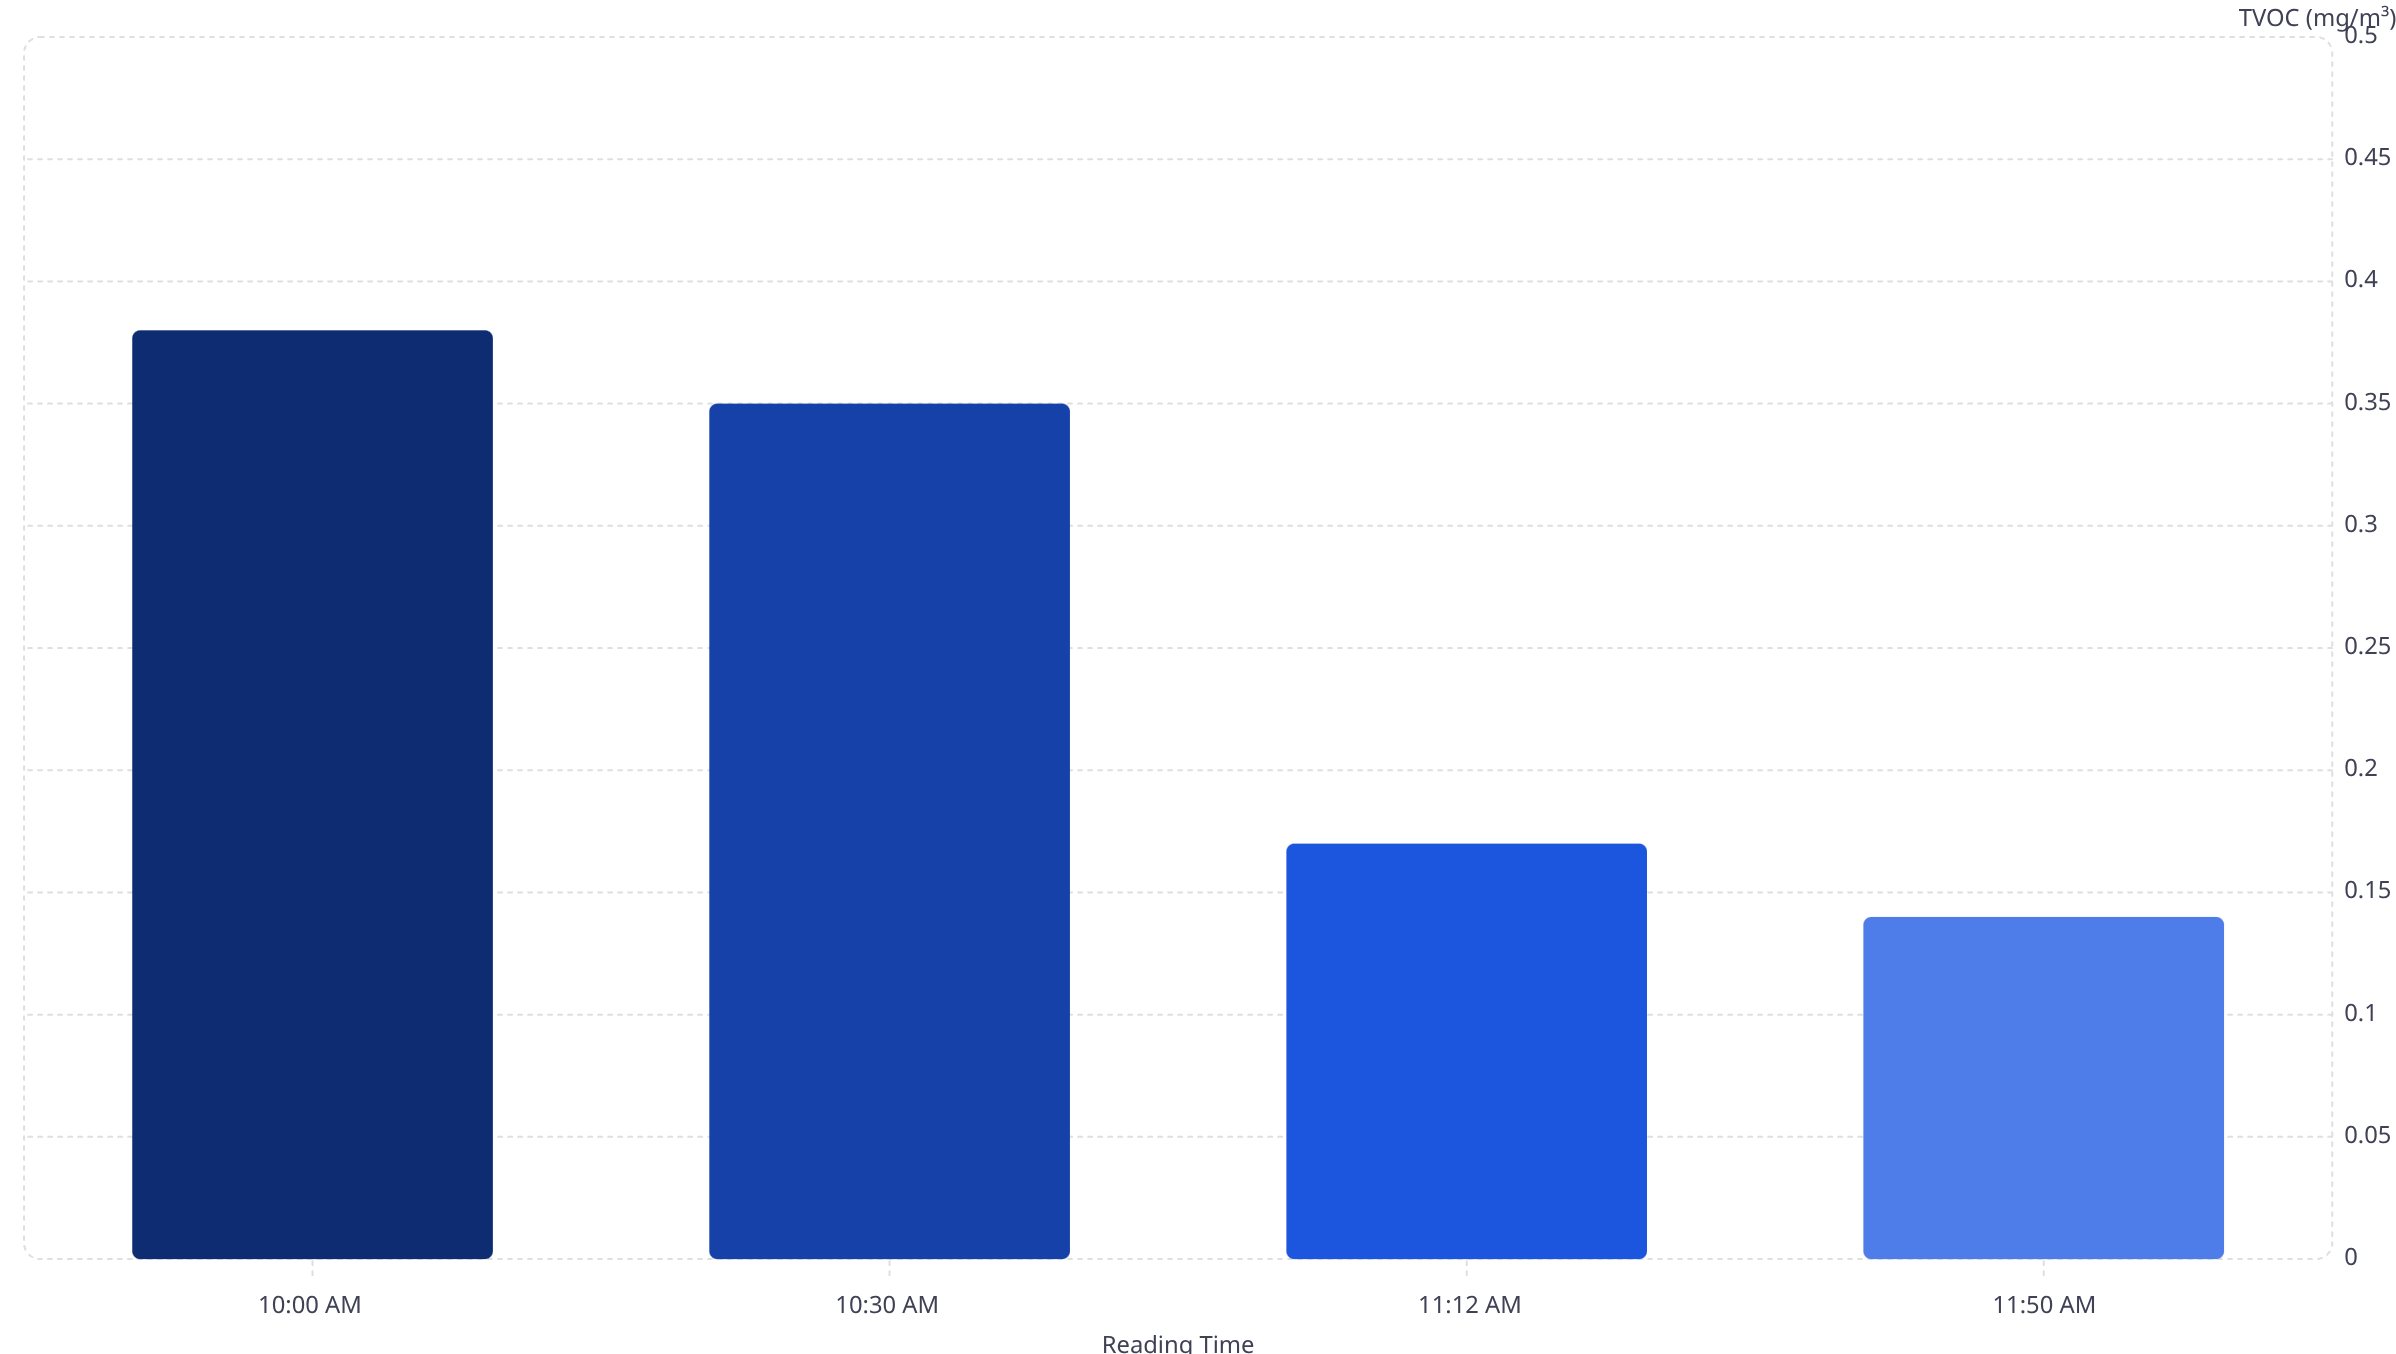
TVOC (mg/m3) across four readings · Safe limit = 0.50 mg/m3
Three readings from the adjacent meeting room — independent dataset, consistent improvement. AQI dropped from 66 to 19 in under 70 minutes.
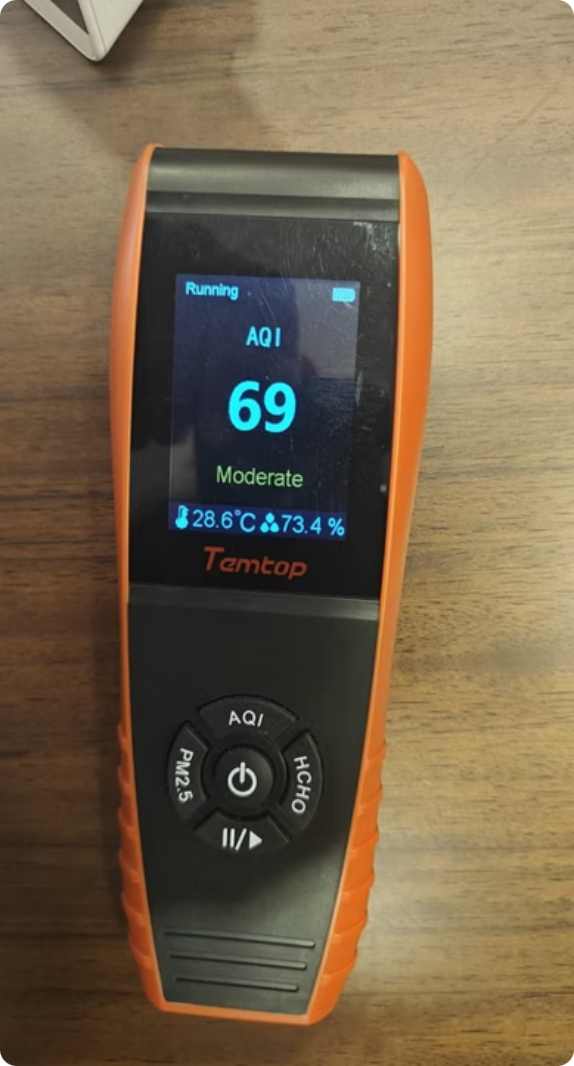
Reading 1 10:12 AM – Baseline AQI: 66
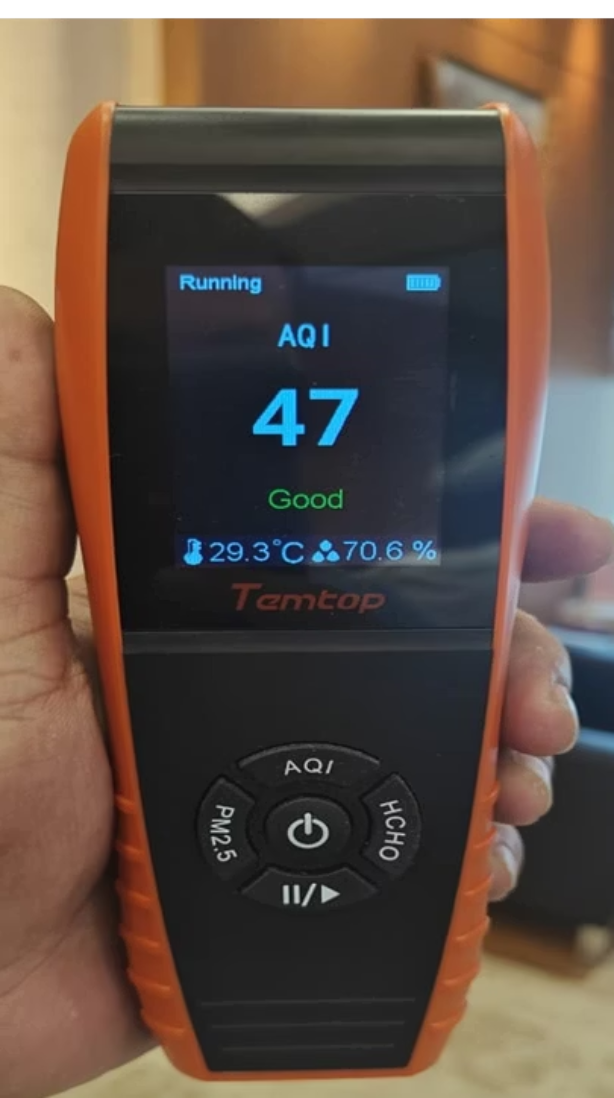
Reading 2 10:47 AM – ZonAir3D ON AQI: 32
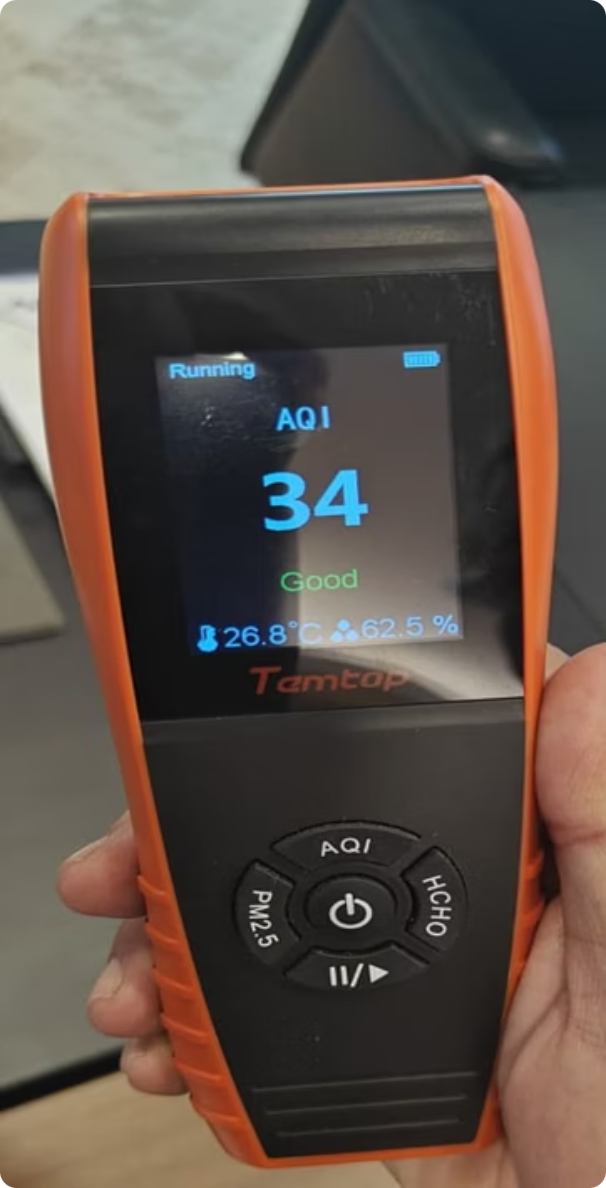
Reading 3 11:22 AM – ~70 min AQI: 19
Unedited video documentation captured during the monitoring session. Shows the Trotec PC220 sensor displaying live air quality data alongside the ZonAir3D unit in the Chairman’s Office.
ZonAir3D demonstrated consistent, measurable improvement across all air quality parameters within a single monitoring session. All parameters moved to compliant or Good levels without disrupting executive workflows.
Direct comparison of key parameters at session start (10:00 AM baseline) versus final reading (11:50 AM — 110 minutes post-activation).
ZonAir3D demonstrated consistent, measurable improvement across all air quality parameters — particulate matter, AQI, TVOC — within a single monitoring session. Results were achieved in under two hours, confirmed across two independent rooms, and supported by timestamped sensor photographs and live video documentation.
For executive environments where air quality directly impacts cognitive performance, decision-making quality, and occupant health, ZonAir3D delivers verified results — not claims.